Visualizing the model
Now we want to visualize the system. Note that this requires an analysis of the model.
On the right side of the GUI you find the Zoom and Visualization panel.
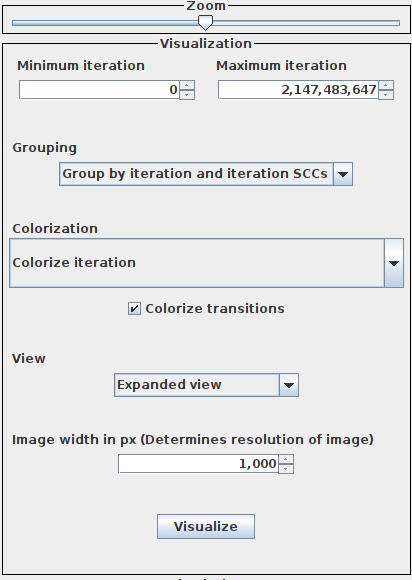
Visualization panel
Minimum and maximum iteration
The analysis assigns each state an iteration number, indicating when the state was discovered. You can adjust which states to be displayed, by changing the minimum and maximum iteration. E.g. minimum iteration = 1 and maximum iteration = 3 would only display states with an iteration number 1,2 or 3.
Grouping states
By default states are grouped by iteration and iteration SCCs, i.e. all states with the same iteration number are grouped together and within this group they are grouped together again if they belong to the same strongly-connected component. You can also group the states only by iteration (number) or iteration SCCs.
Colorization
Colorize iteration: The states are colored according to their iteration (number), i.e. all states discovered within the same iteration have the same color. The lower the iteration number, the more red the color. The higher the iteration number, the more blue the color.
Colorize steady state: The states are colored according to the steady-state distribution of the whole system. The darker the shade of red, the more probability mass is located in that state.
Colorize steady state in SCCs: The states are colored according to the steady-state distribution of the strongly-connected component they belong to. The darker the shade of red, the more probability mass is located in that state. In the case that a strongly-connected component consists of only one state, the entire probability mass is located in that state.
Colorize refinement suggestions: Colorizes the states where non-determinism is present in blue and colorizes states where high level degradation is present in red.
Colorize correlation: Two buttons below the combobox appear, where you can edit two correlations. If you press one of the buttons, a dialog will open, prompting you to add value pairs.
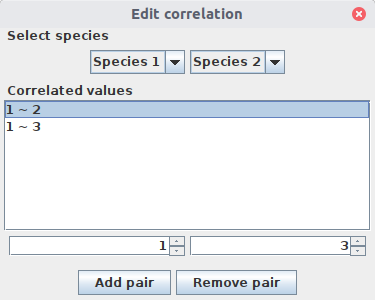
In the figure above, we want to colorize a correlation between Species 1> and Species 2. More precisely, all states with population level 1 for Species 1 and population level 2 or population level 3 for Species 2 will be colored in blue (Correlation 1) or yellow (Correlation 2), respectively. If both correlations are satisfied in one state, it is colored in green.
View
Expanded view: Displays all states, with rectangles grouping the states according the grouping choice (see above).
Collapsed view: States belonging to the same group are collapsed into one single state. If you have chosen Group by iteration and iteration SCCs, the states are collapsed according to the strongly-connected component they belong to.
Image width
Changing the image width is effectively changing the resolution of the produced image. This particularly useful, when exporting the image.
Visualize
Press the Visualize button and in the Viewer panel you should be able to see the model. Depending on the number of states of the system and chosen resolution, this might take a few seconds.
Exporting the image
Simply go the Visualization menu in the menu bar and select Export as DOT file or Export as PNG file.